
How EakLab Reduced Reporting Time by 98% With Data Analytics & Engineering
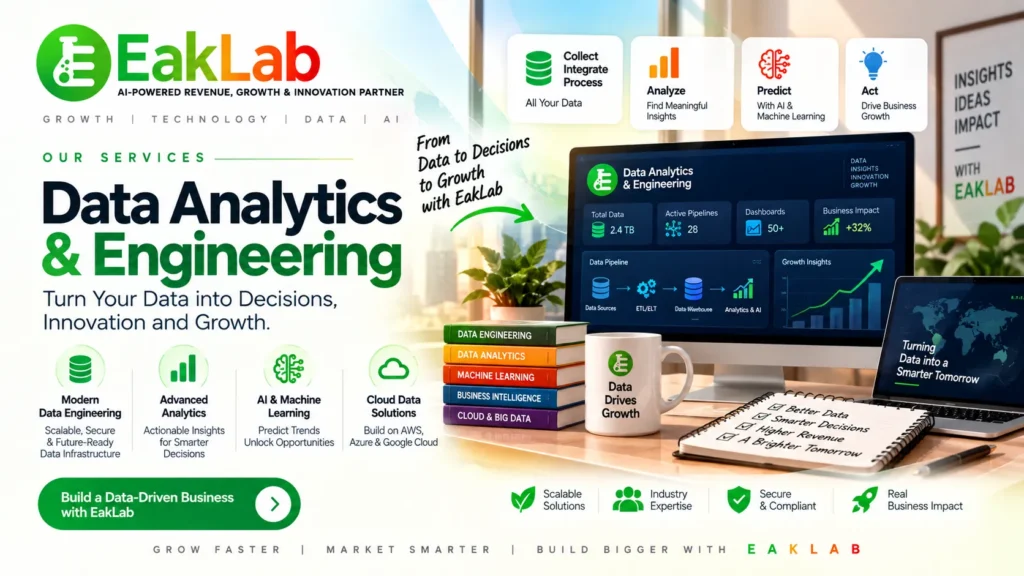
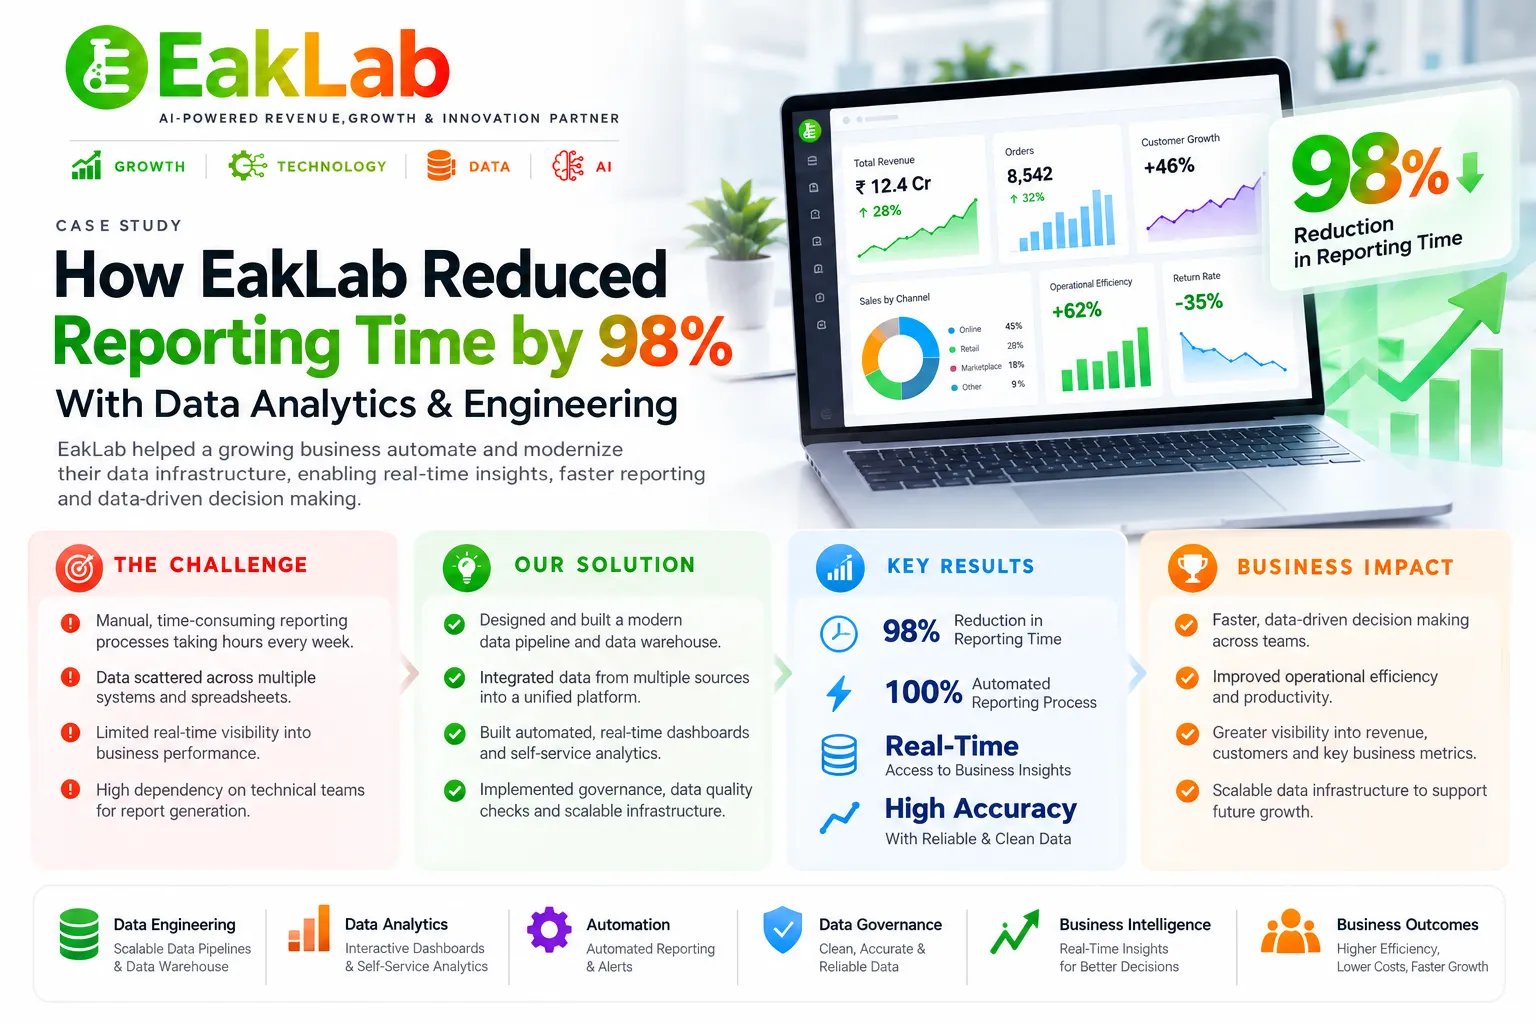
EakLab helped transform fragmented business data into a connected, scalable and analytics-ready environment. The initiative focused on integrating multiple data sources, automating data pipelines, improving data quality and making business intelligence more accessible to teams.
The objective was to enable faster reporting, more consistent performance metrics and better-informed business decisions without relying heavily on manual data consolidation.
About the Client
The client was a growing B2B organization generating data across marketing, sales, customer management, operations, finance and digital platforms.
As the organization expanded, information became increasingly distributed across CRM systems, spreadsheets, databases, SaaS applications and operational platforms. Different teams relied on different data sources and reporting methods, making it difficult to maintain a consistent view of business performance.
The organization needed a structured data environment to connect information sources, automate recurring data processes and provide reliable analytics for teams and leadership. EakLab was engaged to build a connected data engineering and analytics ecosystem for centralized reporting, business intelligence and future data-driven initiatives.
The Challenge
Several challenges limited data accessibility, reporting efficiency and decision-making.
1. Fragmented Data Sources
Information was spread across applications, databases, spreadsheets and third-party platforms, making a unified view of performance difficult.
2. Manual Reporting
Teams spent significant time collecting, cleaning and combining data before preparing reports.
3. Data Quality Issues
Duplicate records, inconsistent formats and incomplete information affected reporting reliability.
4. Lack of Centralized Data
There was no unified environment where teams could easily access consistent, structured business information.
5. Slow Decision-Making
Management often waited for manually prepared reports before acting on important business information.
6. Limited Timely Visibility
Business leaders lacked timely visibility into important commercial and operational KPIs.
7. Growing Data Volumes
Increasing customer, transaction and operational data required a scalable architecture for future needs.
The EakLab Solution
EakLab designed a data environment around the client’s business requirements, connecting data engineering with business analytics rather than treating them as separate activities.
Data Integration
Connected 28+ sources, including CRM, marketing and sales systems, ecommerce platforms, databases, operational apps, SaaS tools and APIs.
Automated Data Pipelines
Introduced structured ingestion and transformation workflows to reduce manual spreadsheet collection and repetitive preparation.
Data Cleaning & Quality
Addressed duplicate records, missing values, inconsistent formats, invalid records, mismatches and outdated information.
Data Modeling
Structured customer, lead, sales, revenue, marketing, product, operations, transaction and customer-activity data.
Business Intelligence Dashboards
Centralized visibility across revenue, sales pipeline, marketing, acquisition, retention, operations, products and financial metrics.
Self-Service Analytics
Enabled business users to explore relevant information without relying entirely on technical teams for every report.
Data Governance
Established practices for data ownership, access control, definitions, quality, reporting consistency and security.
Analytics Automation
Automated recurring reporting where possible to reduce manual preparation and improve access to refreshed metrics.
Monitoring & Optimization
Evaluated pipeline performance, data quality, processing times, dashboards, new sources and changing business requirements.
Implementation & Execution
Phase 1 — Data Discovery & Assessment
Assessed sources, databases, CRM and SaaS platforms, spreadsheets, APIs, reporting workflows, data quality and business KPIs to establish the roadmap.
Phase 2 — Data Architecture
Designed scalable infrastructure to centralize information and support ingestion, transformation, storage, modeling, analytics, BI, governance and potential future AI initiatives.
Phase 3 — Data Integration
Connected more than 28 data sources through structured pipelines into a centralized environment.
Phase 4 — Automated Data Engineering
Built scheduled ingestion, transformation, validation, error handling, synchronization and pipeline-monitoring workflows.
Phase 5 — Data Cleaning & Standardization
Addressed duplicate records, missing values, inconsistent formats, invalid entries and mismatches to provide a more reliable analytics foundation.
Phase 6 — Data Modeling
Developed structured models around key business areas to support consistent cross-functional reporting.
Phase 7 — Business Intelligence Dashboards
Brought key metrics into a centralized analytics environment covering revenue, sales, marketing, customers, operations, products and financial performance.
Phase 8 — Self-Service Analytics & Governance
Enabled more independent access to information and supported consistent definitions, access management, ownership and data quality.
Phase 9 — Analytics Automation
Automated recurring reporting wherever possible to reduce manual preparation and distribution of business information.
Phase 10 — Monitoring & Optimization
Evaluated pipeline performance, data quality, processing time, dashboard performance and changing business requirements for ongoing improvement.
Results: Measurable Data & Analytics Impact
The provided EakLab PDF reports the following before-and-after metrics.
More Connected Data Sources
7 → 28+ sources
Less Manual Reporting
42 → 9 hours per week
Faster Report Generation
2.5 days → 2.5 hours (reported)
Data Quality Accuracy
Up from 82%
Fewer Duplicate Records
8.6% → 1.7%
Analytics Users
65 → 310 users
Automated Data Pipelines
12 → 76 pipelines
Faster Decision-Making
5 days → 1.5 days
Detailed Performance Metrics
| KPI | Before | After | Reported Improvement |
|---|---|---|---|
| Connected data sources | 7 | 28+ | 300%+ increase |
| Manual reporting effort | 42 hours/week | 9 hours/week | 79% reduction |
| Report generation time | 2.5 days | 2.5 hours | 98% reduction (as reported) |
| Data quality accuracy | 82% | 97% | +15 percentage points |
| Duplicate records | 8.6% | 1.7% | 80% reduction |
| Analytics users | 65 | 310 | +377% |
| Automated data pipelines | 12 | 76 | +533% |
| Data processing volume | 1.8 million records/month | 8.4 million records/month | +367% |
| Decision-making cycle | 5 days | 1.5 days | 70% faster |
| Dashboard refresh cycle | Weekly | Near real-time | Significant improvement |
Business Outcomes
Reduced Manual Reporting
Weekly reporting effort decreased from 42 hours to 9 hours, reducing repetitive data-preparation work.
Faster Report Generation
The reference reports a reduction in report-generation time from approximately 2.5 days to 2.5 hours.
Improved Data Quality
Data-quality accuracy increased from 82% to 97%, creating a more reliable basis for analytics and reporting.
Fewer Duplicate Records
Duplicate records decreased from 8.6% to 1.7% following data cleaning and standardization.
Greater Analytics Adoption
Analytics users increased from 65 to 310, reflecting broader access to business intelligence.
Expanded Automation
Automated data pipelines increased from 12 to 76, expanding automated data processing.
Greater Data Processing Capacity
Monthly processing volume grew from approximately 1.8 million to 8.4 million records.
Faster Decision-Making
The average decision-making cycle decreased from approximately five days to 1.5 days.
Business Value & ROI
The data transformation created value across several areas of the organization.
Data
More centralized, structured and reliable business information.
Analytics
More accessible, automated and actionable insights.
Operations
Less manual work and faster reporting.
Management
Better visibility into business performance and faster decisions.
Technology
A scalable, integrated and governed data environment.
Future Innovation
An analytics foundation that can support future AI initiatives.
EakLab’s Data Analytics & Engineering Framework
1. Data Discovery
Understand business objectives, data sources, reporting requirements and existing technology.
2. Data Architecture
Design the appropriate data infrastructure, storage, integration and processing architecture.
3. Data Engineering
Build automated pipelines for ingestion, transformation, validation and processing.
4. Data Modeling
Structure business data into consistent, analytics-ready models.
5. Analytics & BI
Develop dashboards, reports and analytics environments around business KPIs.
6. Data Governance
Establish data-quality, access, ownership and governance practices.
7. Automation
Automate recurring data processing, reporting and analytics workflows.
8. Optimization
Continuously improve data pipelines, analytics performance and business intelligence capabilities.
Why EakLab for Data Analytics & Engineering?
Business-Focused Data Engineering
Connect data engineering initiatives with business requirements instead of treating infrastructure as an isolated technical project.
Scalable Data Architecture
Design data platforms to support increasing data volumes, users and evolving business requirements.
Automated Data Pipelines
Replace manual data collection and repetitive processing with structured, monitored pipelines.
Analytics & Business Intelligence
Combine engineering and analytics capabilities to turn raw data into accessible business intelligence.
Data Quality & Governance
Incorporate quality, consistency, access management and governance into the broader data strategy.
AI-Ready Data Foundations
Build reliable data foundations that can support future AI, machine learning and intelligent automation initiatives.
Growth + Technology + Data + AI
Bring together Growth, Technology, Data and AI to connect analytics initiatives with broader digital transformation objectives.
Related Posts: